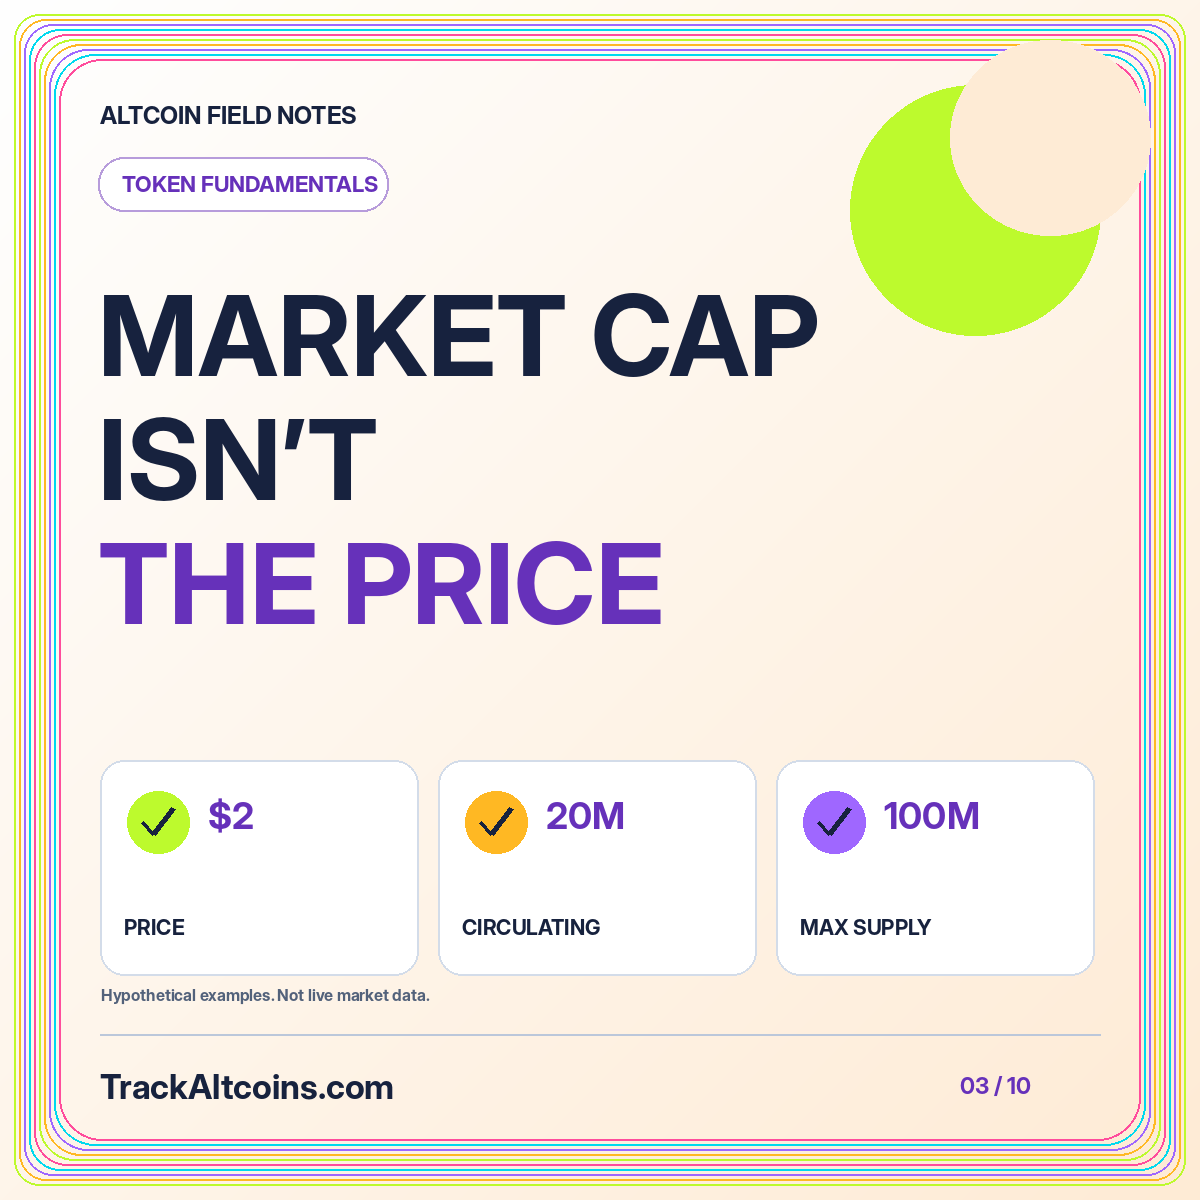
Market Cap vs. Fully Diluted Valuation: Read the Supply
Understand market capitalization, circulating supply, and fully diluted valuation with practical examples.
Read the field noteTracking & Research
Build an altcoin research workflow with verified identities, useful measurements, timestamps, and an organized watchlist.
An altcoin tracker should help you answer a question, not simply fill a screen with moving numbers. You might want to understand a token's identity, compare market activity, organize research, or reconcile holdings across wallets. Those are different jobs. Starting with the job makes it easier to decide which information belongs on your screen and which information can wait.
This guide builds a repeatable research workflow without requiring a wallet connection. The examples are hypothetical, not current quotes or suggested investments. Begin with the altcoin research directory to explore assets, then use the process below to turn a collection of interesting names into an organized record of what you know and what remains uncertain.
In this guide, altcoin means a cryptocurrency other than Bitcoin. That broad label does not make every asset comparable. A network's native coin, an application token, and a token representing another asset can have very different purposes. Put a short description beside each entry so that your watchlist does not quietly become a comparison of unrelated things.
Choose one initial objective. A market watchlist tracks reference prices and changes. A holdings record tracks quantities and ownership locations. A research notebook tracks evidence and unanswered questions. You can combine these later, but a single clear starting objective prevents a common mistake: treating a promising chart as though it were a complete understanding of an asset.
Names and ticker symbols are useful labels, but they are weak identifiers. Record the network and, for a token issued on that network, its contract or mint address. For a native asset, explicitly record that it is native rather than inventing a contract address. Keep the source used to verify the identity alongside the record.
Imagine two unrelated projects both using the fictional ticker NOVA. A price lookup based only on that ticker might attach the wrong price to your research. A chain-aware identifier makes the mismatch easier to detect. Do not shorten identifiers in your underlying notes even when the interface displays an abbreviated version. The complete value is what allows a later reviewer to reproduce your check.
A bridged representation, a wrapped asset, and an exchange account balance are not interchangeable records. They may refer to related economic exposure while depending on different custody or redemption arrangements. Give each representation its own identity, then document the relationship. This keeps a helpful grouping feature from concealing a meaningful difference in risk.
Before comparing prices, check the quote currency, observation time, and methodology. A dollar-denominated quote and a quote against another token are not the same measurement. Similarly, a value from yesterday and one collected moments ago should not share an unlabeled column. A timestamp belongs beside the data, not hidden in a general website footer.
CoinGecko's published methodology explains how that provider constructs market information and addresses aspects of exchange data quality. The practical lesson is to understand a provider's definitions before combining its figures with another source. A reference price is useful context; it is not a promise that a particular order can execute at that price.
A beginner's record can start with identity, reference price, quote currency, circulating supply, volume window, source, and observation time. Add a short explanation of why each field matters to your question. When a field is unavailable, write “unknown” rather than inserting zero. Zero supply, zero activity, and missing information are very different states.
Separate your observations from your interpretations. “The reported volume is higher than the previous observation” describes a comparison. “New investors are arriving” is an interpretation that needs additional evidence. Keeping the two apart makes your notes more useful when a later review reveals that the data source changed or that one venue dominated the measurement.
Use matching time windows when you compare percentage changes. A twenty-four-hour rolling change differs from a change since midnight in your time zone. The same principle applies to supply and market value: a comparison can become misleading when one figure was collected before an event and another afterward. Document the cutoff you chose.
For a simple hypothetical calculation, a price moving from 4 units to 5 units rises by 25 percent. A later move from 5 back to 4 falls by 20 percent. Percentages depend on their starting value. Avoid adding daily percentage changes together as though each had the same base. A small worked example is often a better check than an attractive chart.
A useful tracker can say “not verified.” Create a status for unresolved identity, stale pricing, uncertain supply, or missing trading information. These statuses are more informative than a single confidence score whose inputs nobody can inspect. Write the specific question that would resolve each uncertainty, such as confirming whether a supply figure excludes locked allocations.
Do not let an unavailable field disappear when you sort the table. Missing information should remain visible in the record, particularly when it affects a conclusion. The market-cap and dilution guide shows why a price comparison can change meaning when the supply basis is unclear. Treat uncertainty as a result of research, not an inconvenience to remove.
Adding a token to a watchlist does not mean you own it, endorse it, or intend to buy it. Maintain that distinction in your own records. A research list may contain assets you are comparing, monitoring for an event, or studying purely to understand a technical feature. Your holdings ledger should reflect only quantities you can reconcile.
For holdings, record location and quantity before estimating value. A transfer between two wallets you control should not create two lasting holdings. A pending transfer should not automatically be counted as both completed at its destination and still available at its origin. Our portfolio tracking guide explains how to organize these accounting boundaries without confusing movement with profit.
Create a routine appropriate to your purpose rather than reacting to every notification. A weekly research review might check identity changes, supply announcements, missing records, and unresolved assumptions. An event-driven review might focus on a migration or governance change. These are examples of organizing work, not recommendations about when to trade.
Keep a short change log. Record what changed, where you found the evidence, and whether it alters your original question. If nothing relevant changed, say so and stop. A tracker that supports a clear stopping point can be more useful than one that encourages endless refreshing. The objective is a better record, not maximum screen time.
Take one entry and reproduce it from the beginning. Verify its identifier, revisit the source, check the observation time, and recalculate one displayed percentage. Then deliberately test a missing field and a duplicate ticker. If your process silently merges identities or converts unknown values into zero, correct that behavior before expanding the list.
Finally, ask what the tracker cannot tell you. It cannot establish that an asset is suitable for you, guarantee a buyer will appear, or prove that a smart contract is safe. Those limitations belong beside the attractive features. A clearly scoped tool is easier to use responsibly than a tool whose screen implies more certainty than its underlying evidence supports.
Start small, identify assets precisely, and attach definitions and timestamps to important measurements. Keep research interest separate from ownership, and make missing information visible. Once you can explain every column in a short watchlist, adding more assets becomes an organizational decision rather than a leap of faith. Better tracking begins with better questions, not a larger dashboard.
Filed under Tracking & Research. Research education, not a recommendation.
Keep exploring
Understand market capitalization, circulating supply, and fully diluted valuation with practical examples.
Read the field noteLearn why reference prices differ from execution outcomes and how liquidity, price impact, slippage, and fees fit together.
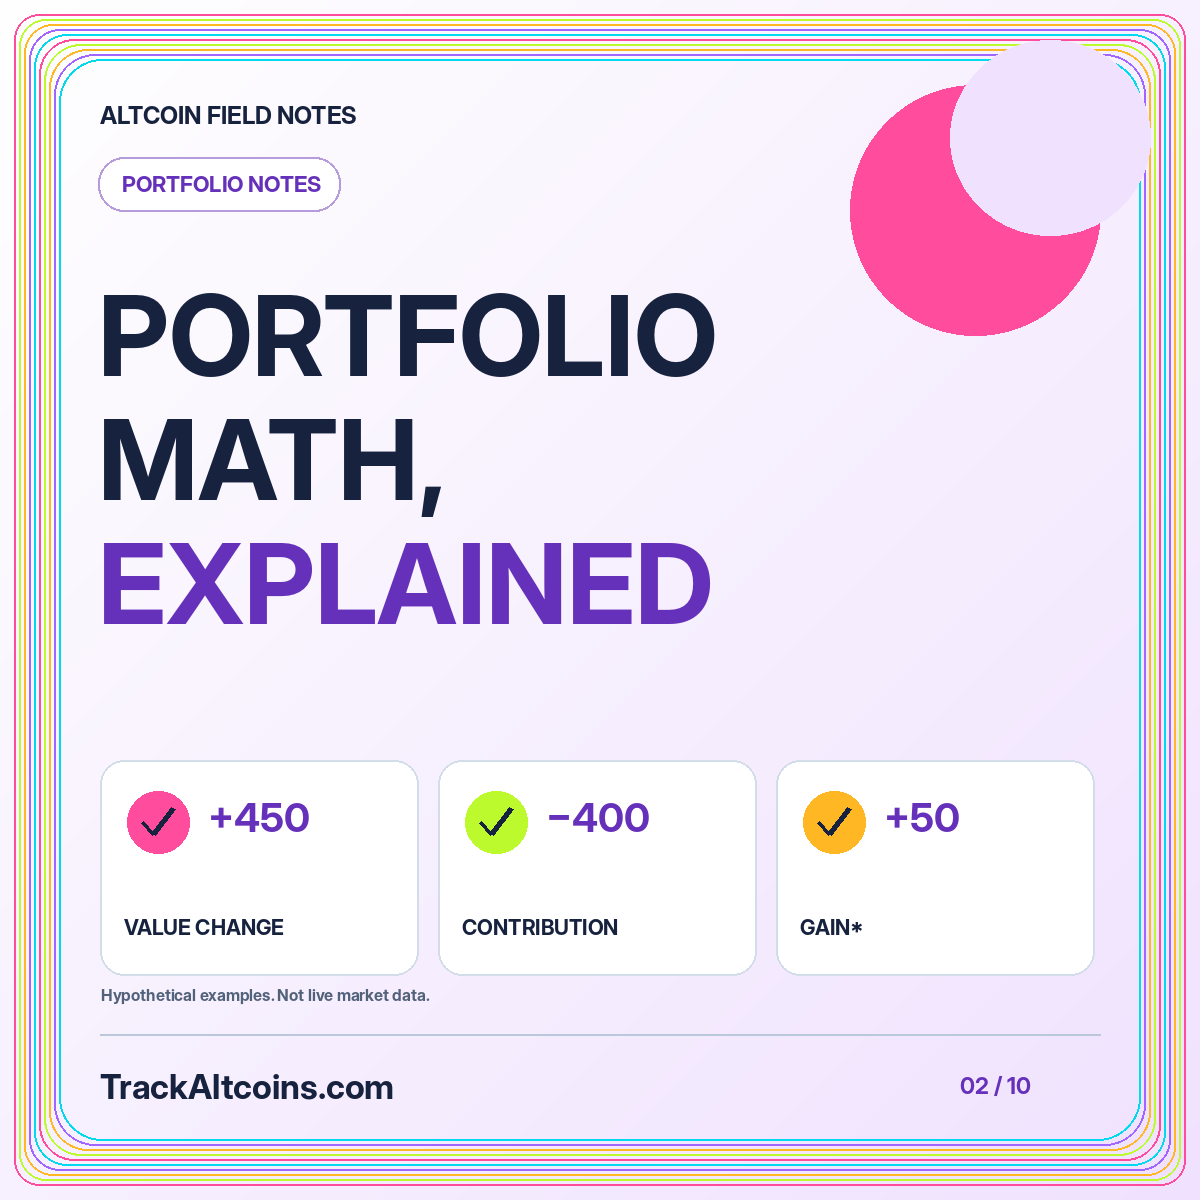
Read the field noteSeparate deposits, internal transfers, fees, and investment returns when organizing cryptocurrency portfolio records.
Read the field note